What it does
DBA Brain collects health metrics from your SQL Server, Oracle, PostgreSQL and MySQL instances, grades them against policies you write, runs your scheduled SQL, takes backups and proves them by restoring them, checks objectives against real measurement history, and tells you about it, on a schedule, without an agent on any monitored machine.
It sends nothing anywhere by itself. No telemetry, no usage reporting, no update check. It connects to the databases and hosts you list, and, only if you turn it on, to a chat service. Nothing else.
Health metrics
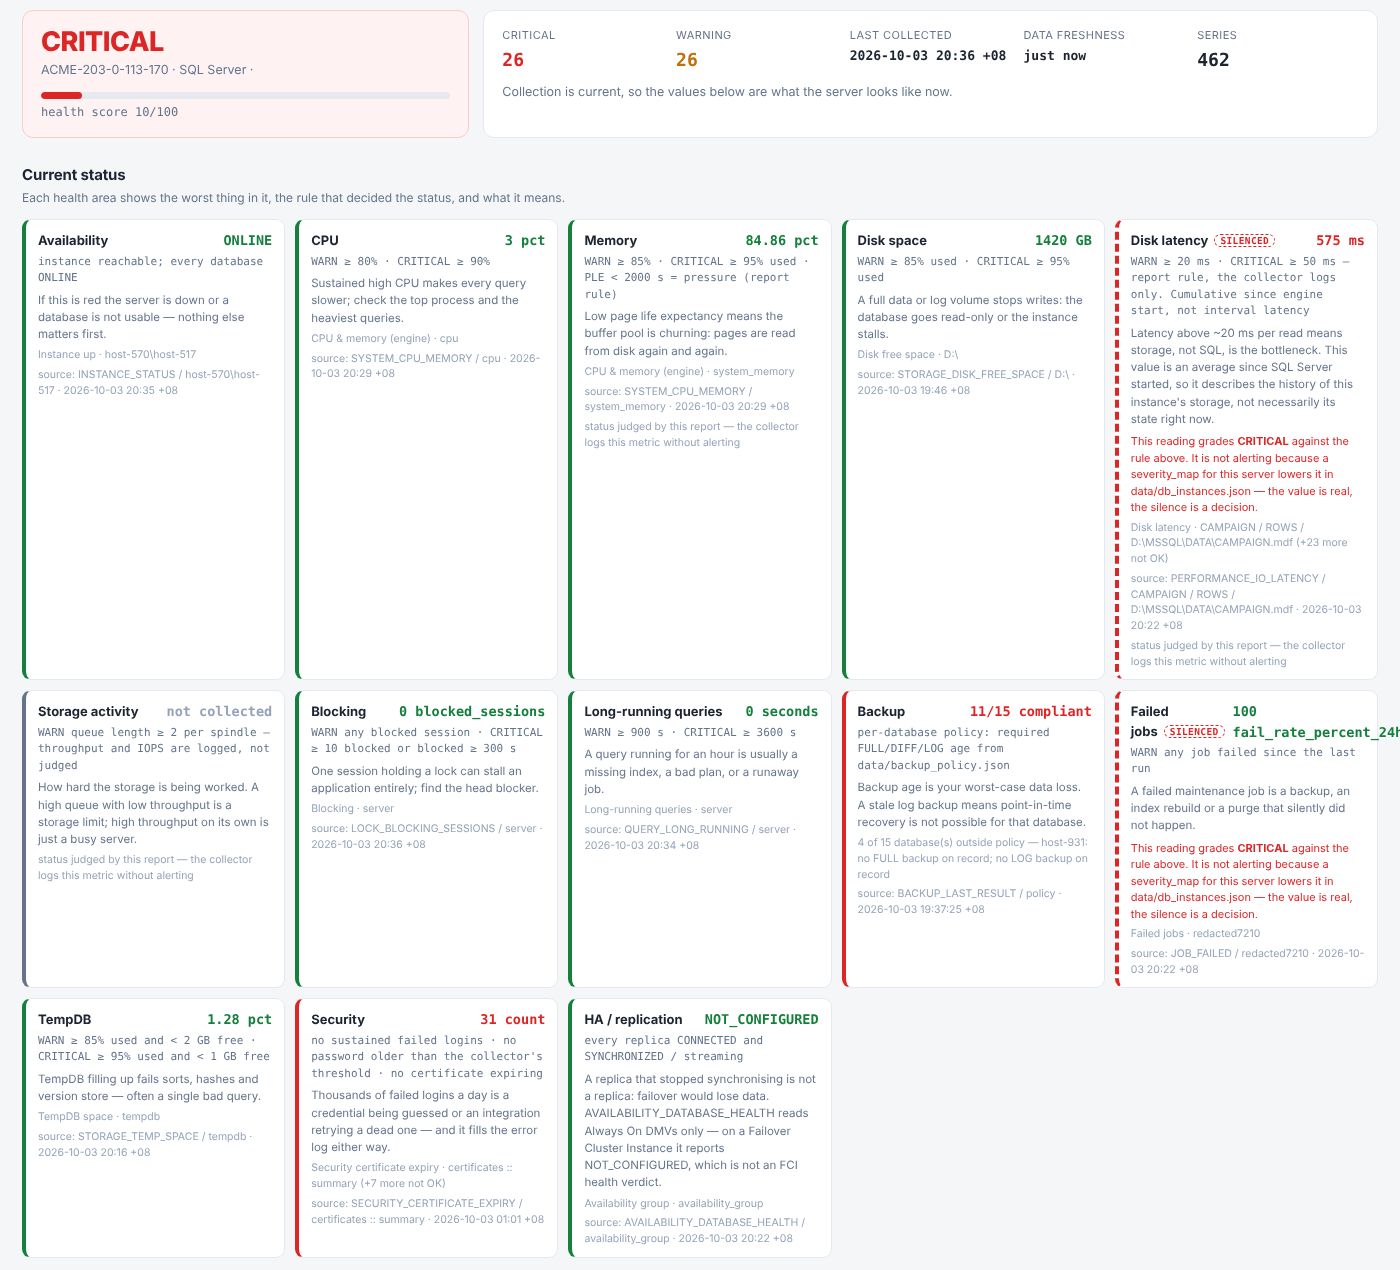
Around ninety metrics across four engines: availability, capacity, performance, recoverability, security, maintenance. Collected and normalised into one shape.
Graded, not dumped
Every measurement is graded against a policy you wrote. You read a verdict (OK, WARNING, CRITICAL) and pull the evidence only for what came back bad.
Backups proven by restore
Runs backups, restores them onto a disposable target, verifies the result and records what was proven and when. The restore is the proof.
Scheduled SQL
Your own SQL, on a schedule or on request, against approved targets, delivered as text or a spreadsheet. The SQL is a reviewable file, never a string in config.
Reports
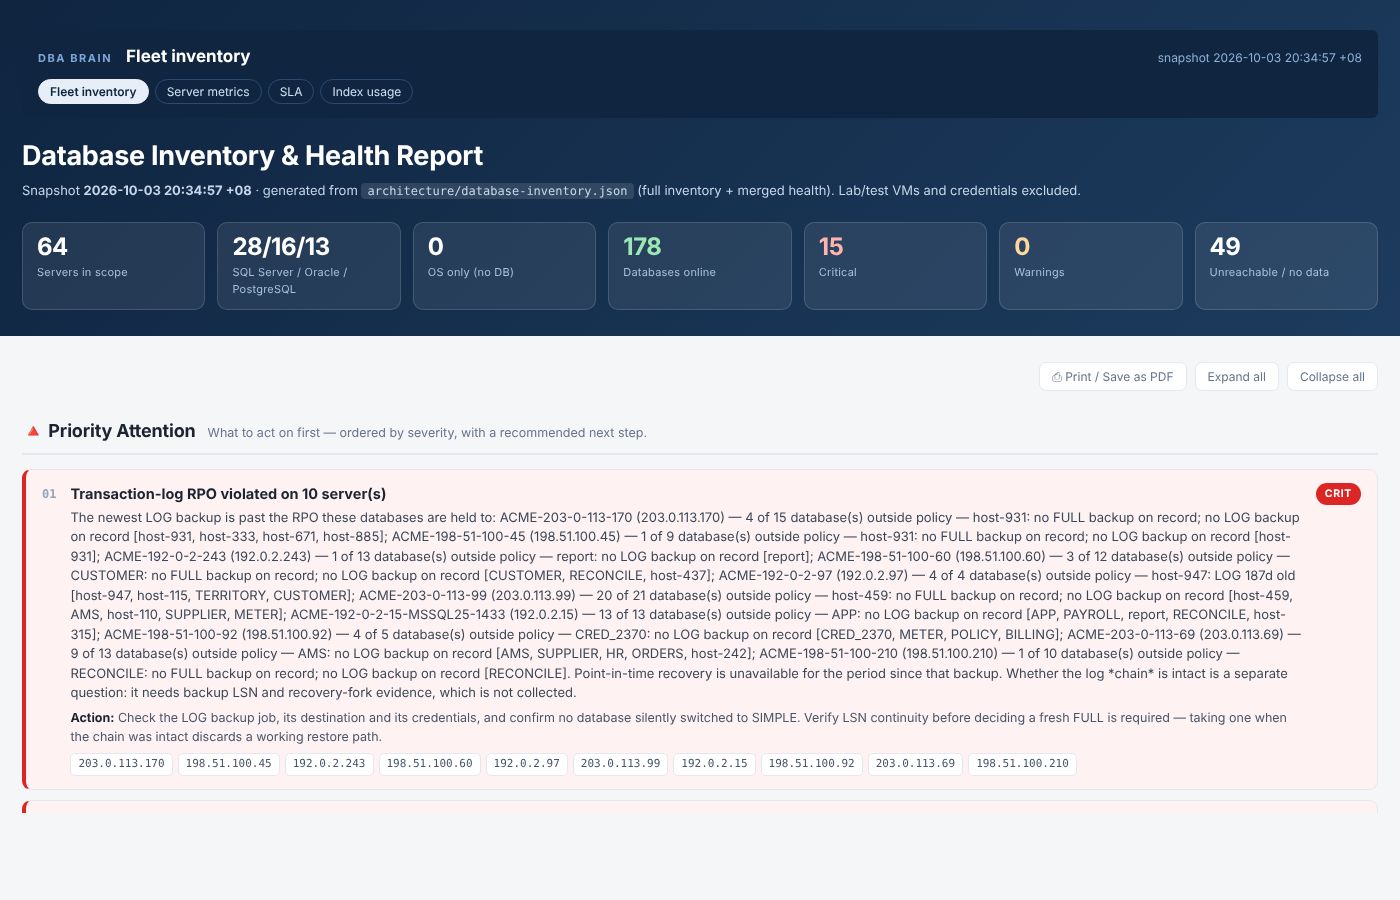
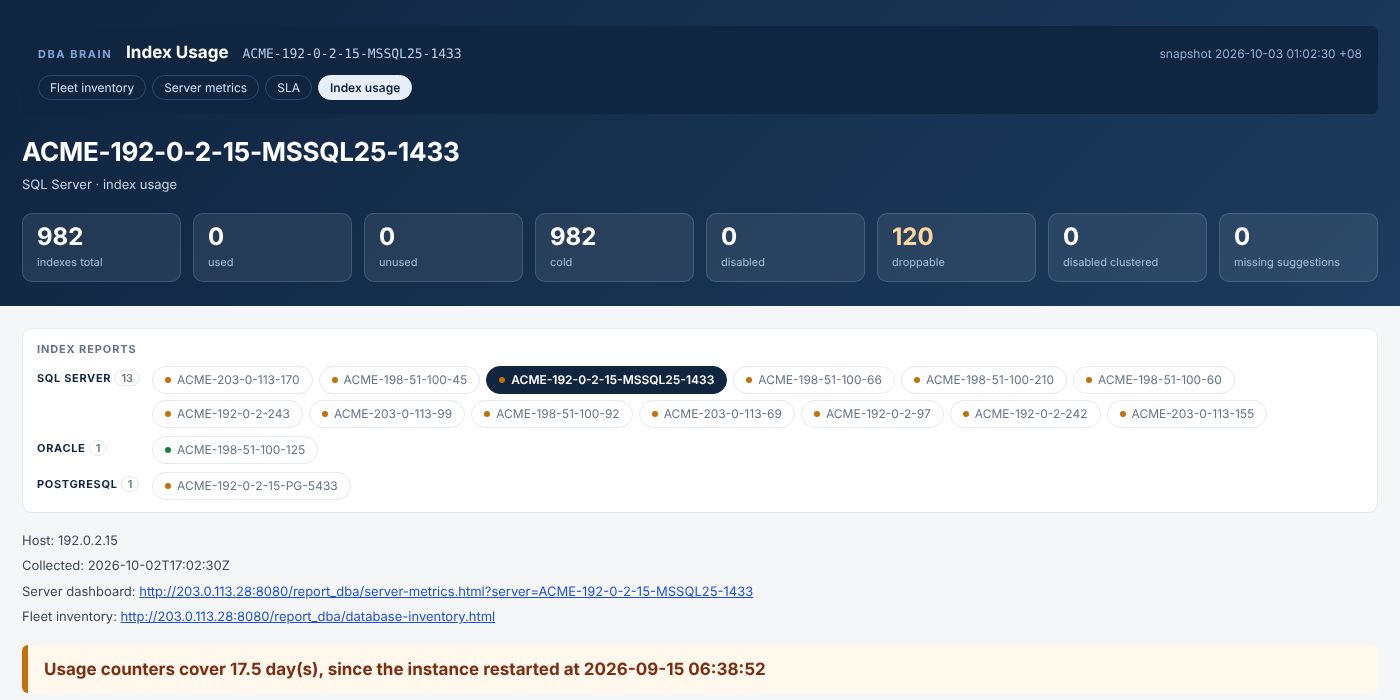
Fleet inventory, per-server metrics, index usage and SLA pages, with a freshness gate so a stale number is never reported as a current one.
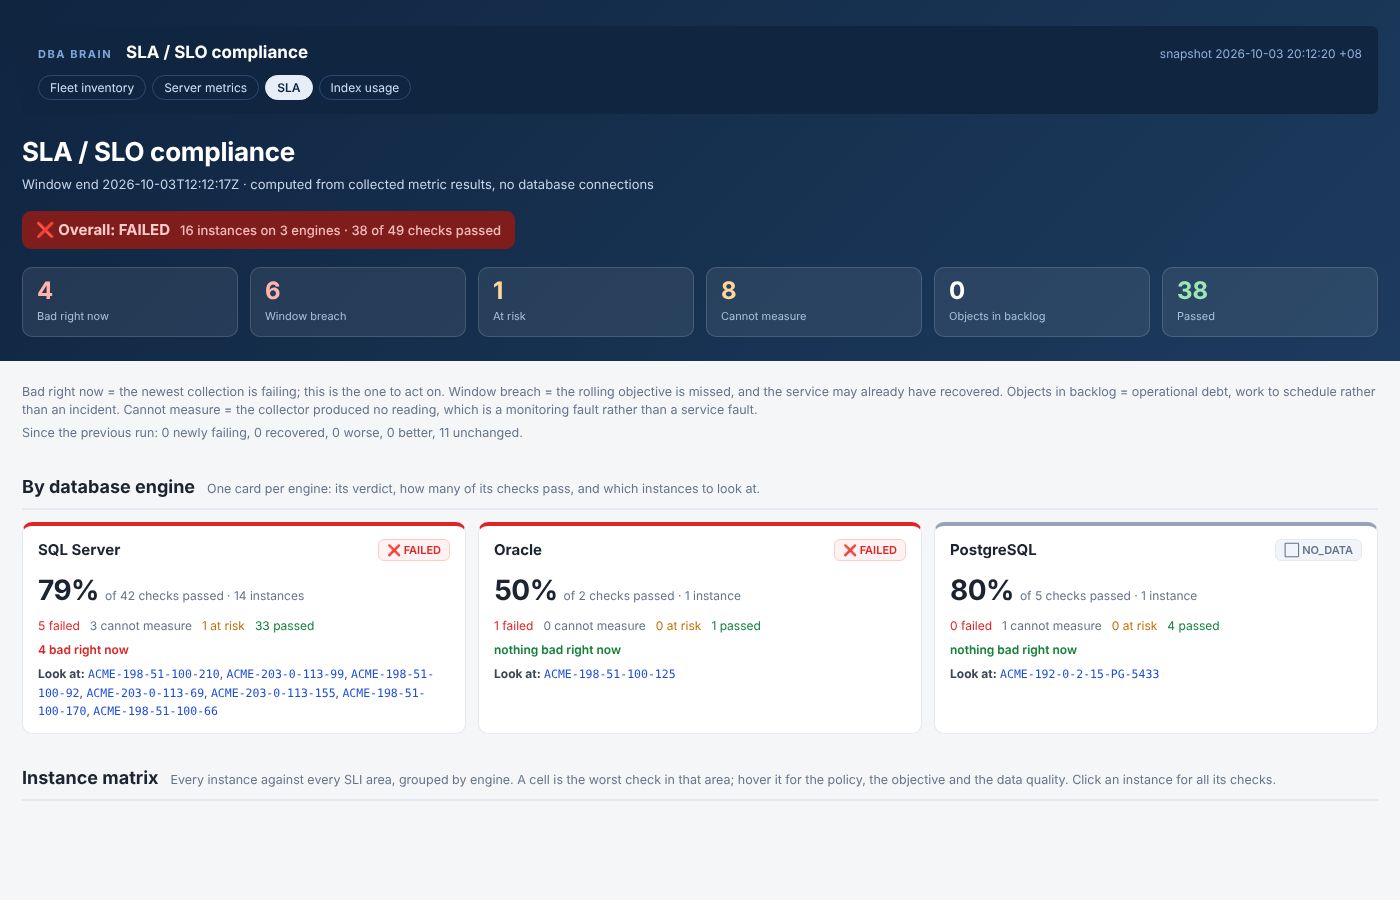
SLA / SLO
Indicators computed from stored measurement history, objectives evaluated with an error budget, and how much of it is left.
Alerts and chat commands
Telegram delivery, one message at a time. Commands people send back are gated by the person's clearance and the chat's.
Config as code
Every decision is a JSON file you keep in version control. A threshold change is a diff and a review, not an edit to somebody's script.
Secrets kept encrypted
PBKDF2-HMAC-SHA256 + Fernet. The passphrase is supplied at run time and never written to disk, a log or the store. Passwords travel on stdin, never argv.
What it is not
- Not an AI agent. It is what an agent operates. Nothing here talks to a model or decides anything on its own.
- Not a dashboard product. The primary interface is a CLI; the primary output is a record in a database you own.
- Installs nothing on your databases. No agent, no extension, no stored procedure. It logs in with a read-only account and asks questions.
What it produces
Real report pages from a live estate, with every name replaced by a stable fake one. Click an image to open it full size.
How it works
One run, end to end
Whoever starts it (the daemon, a person, a chat command or an AI agent), a run takes the same path.
The app hands one JSON request to transport, which starts the shared operations CLI;
that CLI reaches the database or host and answers with one JSON envelope. Results land in the
runtime store, and reports and alerts are built from there.
Every command answers in the same envelope, whether the work succeeded or not:
{
  "success": true,
  "operation": "restore-full",
  "message": "Restored SALESDB_STG to 2026-08-07 01:40:00.",
  "error": null,
  "data": { },
  "metrics": { "duration_ms": 41230 }
}
From a measurement to an alert
data/*.jsonA backup is proven by restoring it
Why: cheap for an AI agent, fine without one
The command a person runs is byte-for-byte the command an agent runs, so there is one code path to audit, and every run is logged the same way whoever started it.
  WITHOUT a tool                        WITH DBA Brain
  agent -> raw SQL -> agent             agent -> DBA Brain -> database

  "check this database"                 "check this database"
    -> SELECT ... dm_os_wait_stats        -> one JSON request
    <- every row, into the context
    -> SELECT ... sys.databases           <- one graded envelope:
    <- every row, into the context             41 checks, 40 OK,
    -> ... once per check, per run             1 WARNING: appdb
    <- all of it, healthy or not               log backup 31h old
The saving is not compression. It is not sending what nobody needed to read. And no model is required: remove the agent and the daemon, schedules, reports and alerts all still run.
15 components
Ten apps, each doing one job with its own CLI and never importing another app, and five shared layers that every app stands on. The list is closed, and every component has exactly one reference doc.
Who may call whom
commonmay not be imported: it is only ever run as a CLI.libmay not run a CLI: it is only ever imported.- No app imports another app. No shared layer imports an app.
- Each rule has a guard test beside it, so the diagram describes what is true, not just what was intended.
Apps
03App command daemon
db_ops/jobs · db-ops daemonThe scheduler: runs each app on its own interval inside its allowed hours, skips one that is still running.
04Metrics engine
db_ops/metricsAround ninety metrics across four engines, collected and normalised into one shape.
05SQL task runner
db_ops/sql_tasksYour own SQL, on a schedule or on request, against approved targets, as text or a spreadsheet.
06Reports
db_ops/reportsScheduled reports and inventory pages, with a freshness gate against stale numbers.
07Chat delivery and commands
db_ops/telegramDelivers the outgoing queue and executes commands, gated by the person's and the chat's clearance.
08Backup / restore
db_ops/backup_restoreRuns backups, restores them onto a disposable target, verifies, and records what was proven.
09SLA / SLO compliance
db_ops/slaIndicators from stored measurement history, objectives with an error budget.
10SRE
db_ops/sreProvisions disposable lab databases for drills: single instances or small HA clusters, in Docker or on VMs.
11Control
db_ops/controlBuilds and deploys the toolkit to another node, and watches the toolkit itself.
12Web host
db_ops/webhostServes the rendered reports over HTTP and hosts the console. Publishes files, never generates them.
Shared layers
01Runtime store
db_ops/dbThe toolkit's own data: job runs, measurements, report state, delivery queue, restore history. SQLite to start, PostgreSQL later.
02Logging engine
db_ops/logging_opsScoped application logs, runtime logs, shared errors and daily archives.
13Common
db_ops/common · CLI onlyReaching a host, running SQL, moving a file, rotating a password. Every command takes one JSON object.
14Lib
db_ops/lib · import onlyPure rules: time windows, notify routing, severity, formatting. Imports nothing from the rest.
15Transport
db_ops/transportThe one client: starts common.cli and db.cli for every component. Imports only lib.
Install
Python 3.12+. Each database driver is an extra, so you install only what you run.
[postgres] | PostgreSQL, pure Python |
[mysql] | MySQL / MariaDB, pure Python |
[oracle] | Oracle, no client library needed for 12.1 and newer |
[mssql] | SQL Server, also needs Microsoft's ODBC driver |
[ssh], [winrm] | OS-level metrics on Linux / Windows hosts |
[all] | everything |
python -m venv .venv
.venv/bin/pip install 'dbabrain[postgres]'
Published on PyPI via trusted publishing.
Five-minute try-out with a throwaway PostgreSQL container:
cd examples/postgres-quickstart
docker compose up -d
python -m db_ops.db.cli      --config config.json init
python -m db_ops.metrics.cli --config config.json collect --dry-run
python -m db_ops.metrics.cli --config config.json collect
python -m db_ops.metrics.cli --config config.json report
Docs and source
- dbabrain on PyPI (download stats)
- Source on GitHub: README, docs, examples
- Architecture and first run
- Changelog
- Security policy: how to report a vulnerability
- License: Apache License 2.0
Contact: donations and investment
DBA Brain is free, open source, and maintained by one person. If you would like to donate, sponsor the project, or talk about investment or partnership, please get in touch directly:
| [email protected] | |
| [email protected] | |
| Phone | +84 888 783 789 (0888 783 789) |
For bugs and feature requests, please use GitHub issues. For security problems, follow the security policy rather than email.